
WebProfiler has been a useful module since Drupal 8. It has helped developers to better understand how Drupal internals work, and to find problems and bottlenecks. Let's dive into its new features.
What's WebProfiler?
WebProfiler has been a useful module since Drupal 8. It has helped developers to better understand how Drupal internals work, and to find problems and bottlenecks.
By the way, it survived the update to Drupal 9 fairly well.
But since the release of Drupal 8 in 2015, a lot of things have changed. In November 2022 Drupal 10 will be released, with some big improvements like Symfony 6 and the support for PHP 8.1 (among many others).
The perfect time to refresh WebProfiler!
The new version of the module is still under active development, but in this article, we want to share some of the next version improvements
The new version of the framework that backs Drupal contains a lot of improvements in the WebProfiler bundle: a new toolbar, more secure and written in a more modern javascript.
Symfony6
A Symfony bundle of course doesn’t work in Drupal, so we cherry-picked the code we needed and moved it (with some adjustments) to the Drupal WebProfiler module.
The result is a more elegant and functional tool to start inspecting a page.
PHP 8.1
Now that Drupal requires PHP 8.1, we can start using all its potential. From Constructor Property Promotion to Match Expression, WebProfiler makes use of a lot of the language new features.
Now the code of the module is fully compliant with Drupal coding standards and it passes level 5 of PHPStan.
Redirects
Sometimes a request returns a redirect response to force the browser to go to a different page (for example after saving a node the system returns a redirect to the canonical view of the page, instead of the edit form).
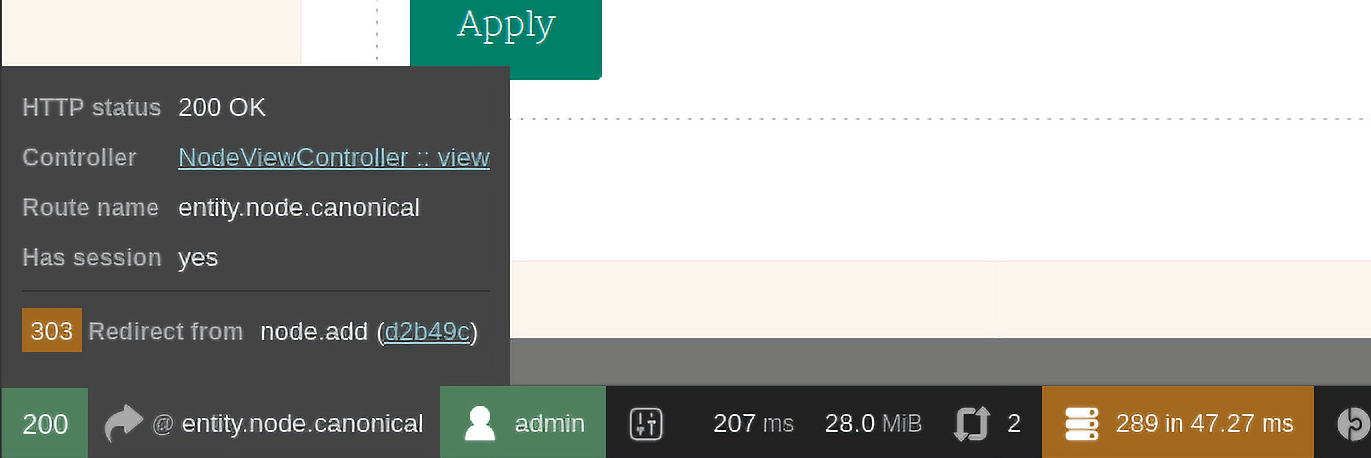
As usual, on the redirected page, WebProfiler shows the toolbar related to that response. What if you want to analyze the previous request (the one that returns the redirect)?
You have two options:
- Just look at the toolbar and you will see an arrow near the response info, hover over it to display the redirection info and a link to that response on the WebProfiler dashboard.
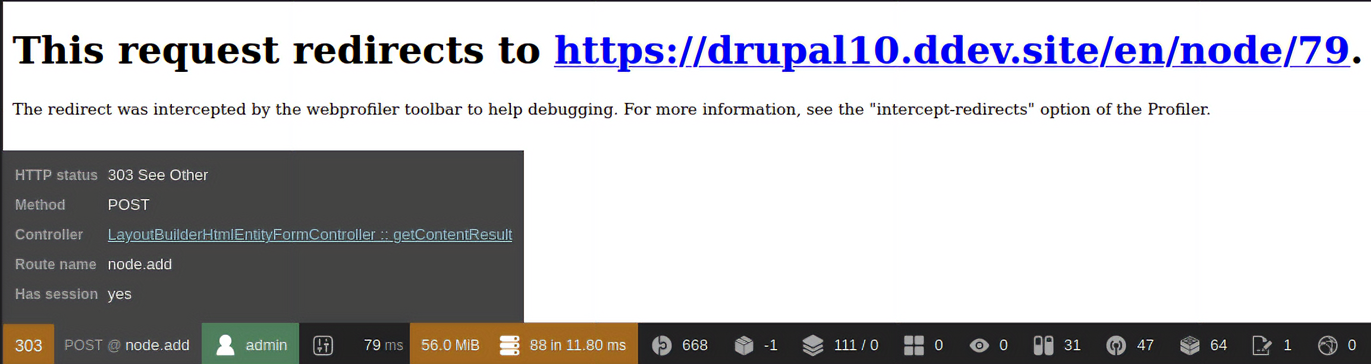
- Go to the WebProfiler configuration page and enable the check “Intercept redirects”:
.png?width=689&name=image%20(5).png)
Then, after every redirect Drupal will show you a blank page with redirect information:
Ajax calls
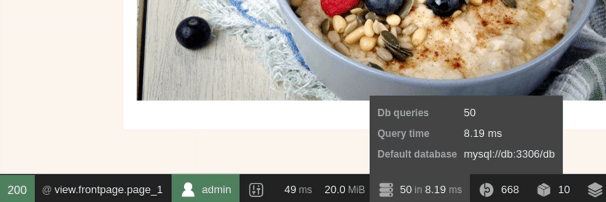
WebProfiler now collects and shows all Ajax calls made by a page:
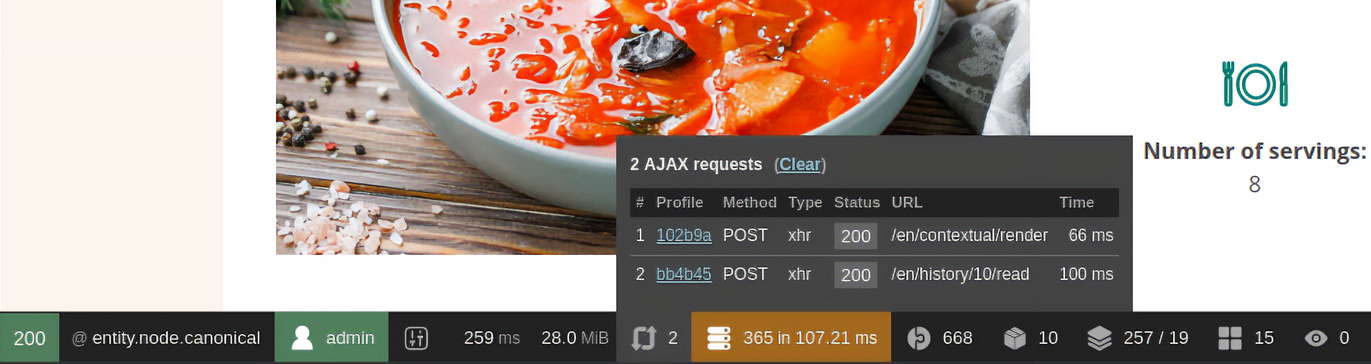
For every call the toolbar prints method, type, status code, url and the time spent in the call itself. And clicking on the profile link, you have access to the full set of collected data for that specific request.
Devel integration
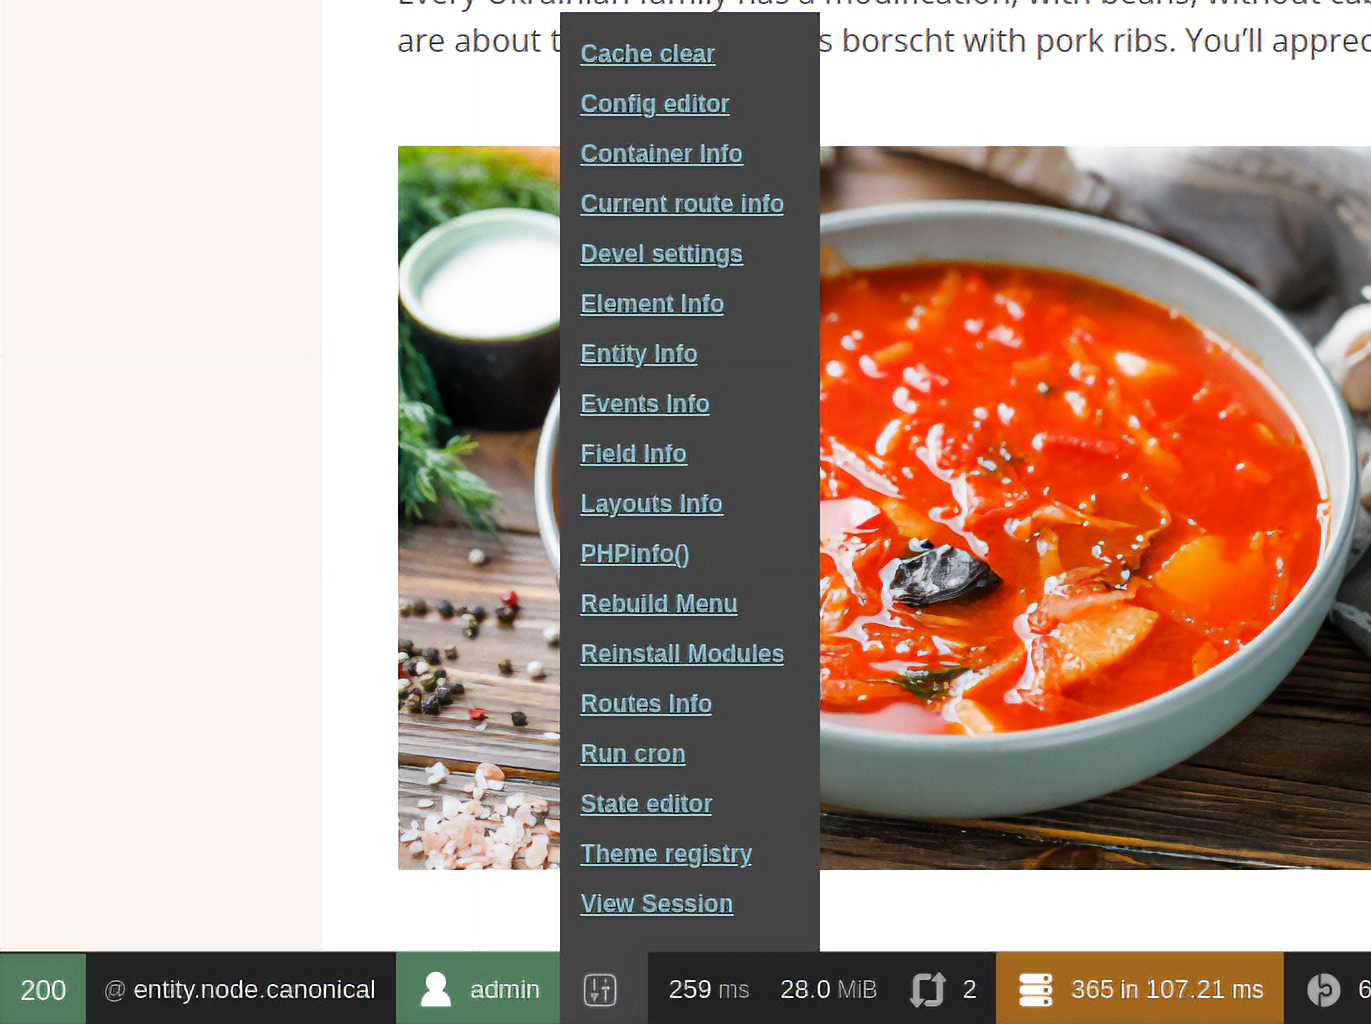
New icon for the Devel widget that shows all the commands available and works on every page and in every language.
BigPipe support
This is a little bit technical.
When the BigPipe module is enabled (and it is enabled by default in the standard profile), every placeholder that Drupal extracts from the page (to allow caching pages for authenticated users) is sent in chunks after the main HTML and in the same HTTP response.
For the system, this is a single request with multiple responses. The old WebProfiler showed data only about the first response, the one with the main HTML.
The new WebProfiler collects and shows data about all responses, allowing you to analyze what happens during the rendering of every component of the page.
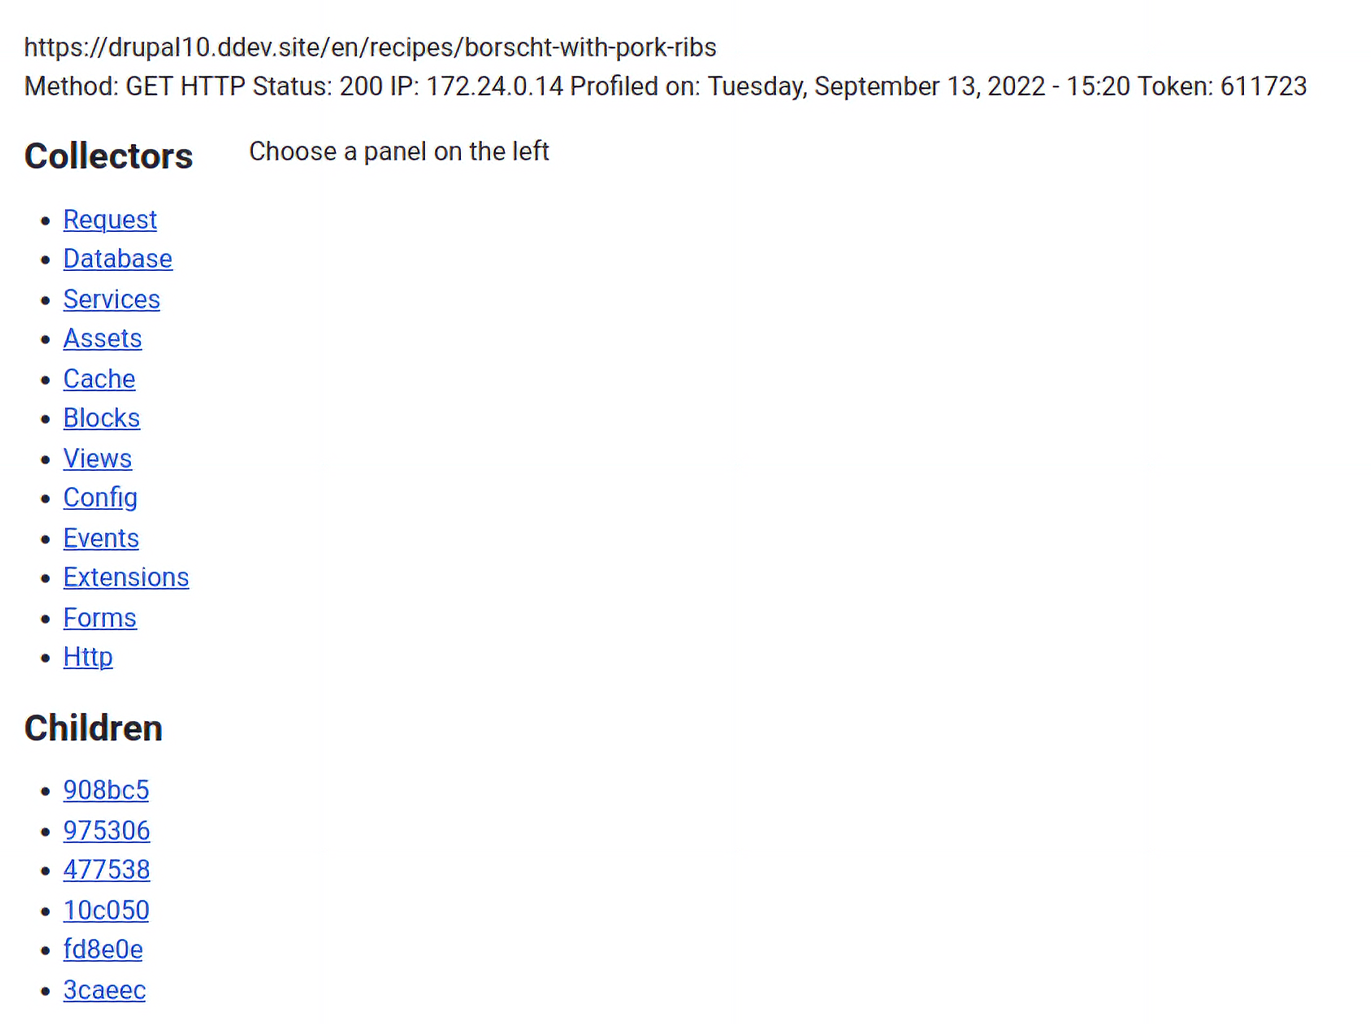
Every request that has multiple responses now has a list of children in the dashboard:
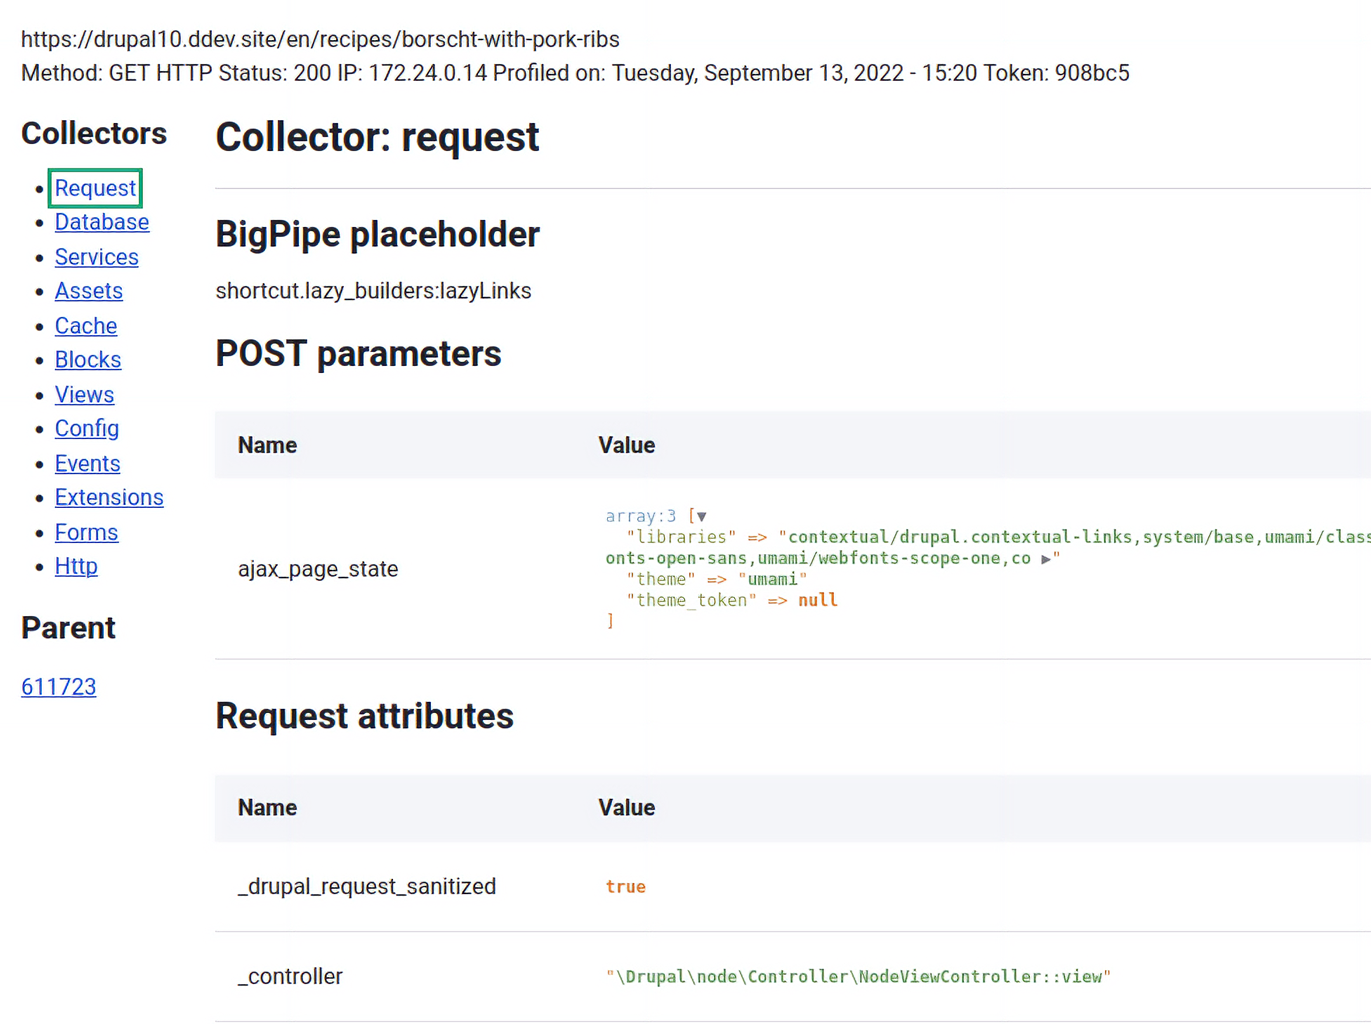
And if a response has been generated by rendering a placeholder from BigPipe we show the callback used too:
Automatic generation of storage decorators
Well… this is even more technical.
To allow us to collect data about configuration entities used on a page, we need to decorate the storage handler of that specific entity type.
A lot of entities use the default handler, implemented in the class \Drupal\Core\Config\Entity\ConfigEntityStorage, but not all.
If a non-standard storage handler is defined, we have to decorate this instead of the default one, and we need to take care of all methods added in future releases (as we need to decorate them also).
To overcome this issue we implemented a way to automatically generate the storage decorators for those entities that define a custom handler. We do that using nikic/php-parser, nette/php-generator and the awesome PhpStorageFactory class from Drupal core (the same used to compile Twig templates to file).
After installing WebProfiler take a look at the folder sites/default/files/php/WebProfiler.
New dashboard
The UI of the new dashboard is still a work in progress, but there’s a big change in how it’s implemented. Where the old WebProfiler used Backbone.js to render the templates, now we use standard Drupal render arrays.
Now every backed developer can contribute to the project, even those who do not want anything to share with frontend frameworks!
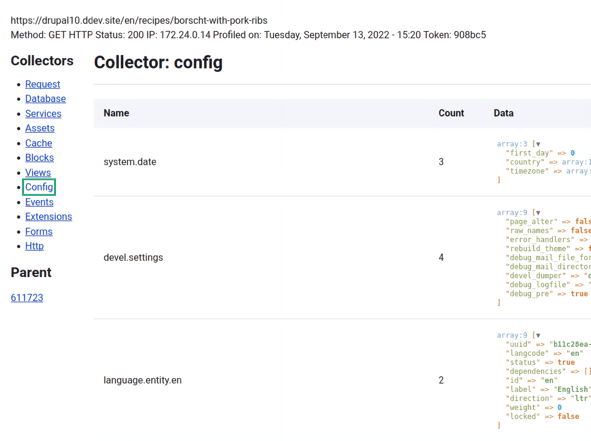
Cache collector improvements
Now the cache collector stores and shows the cache tags used to tag a cache entry, useful to understand which cache will be invalidated when a cache tag is invalidated:
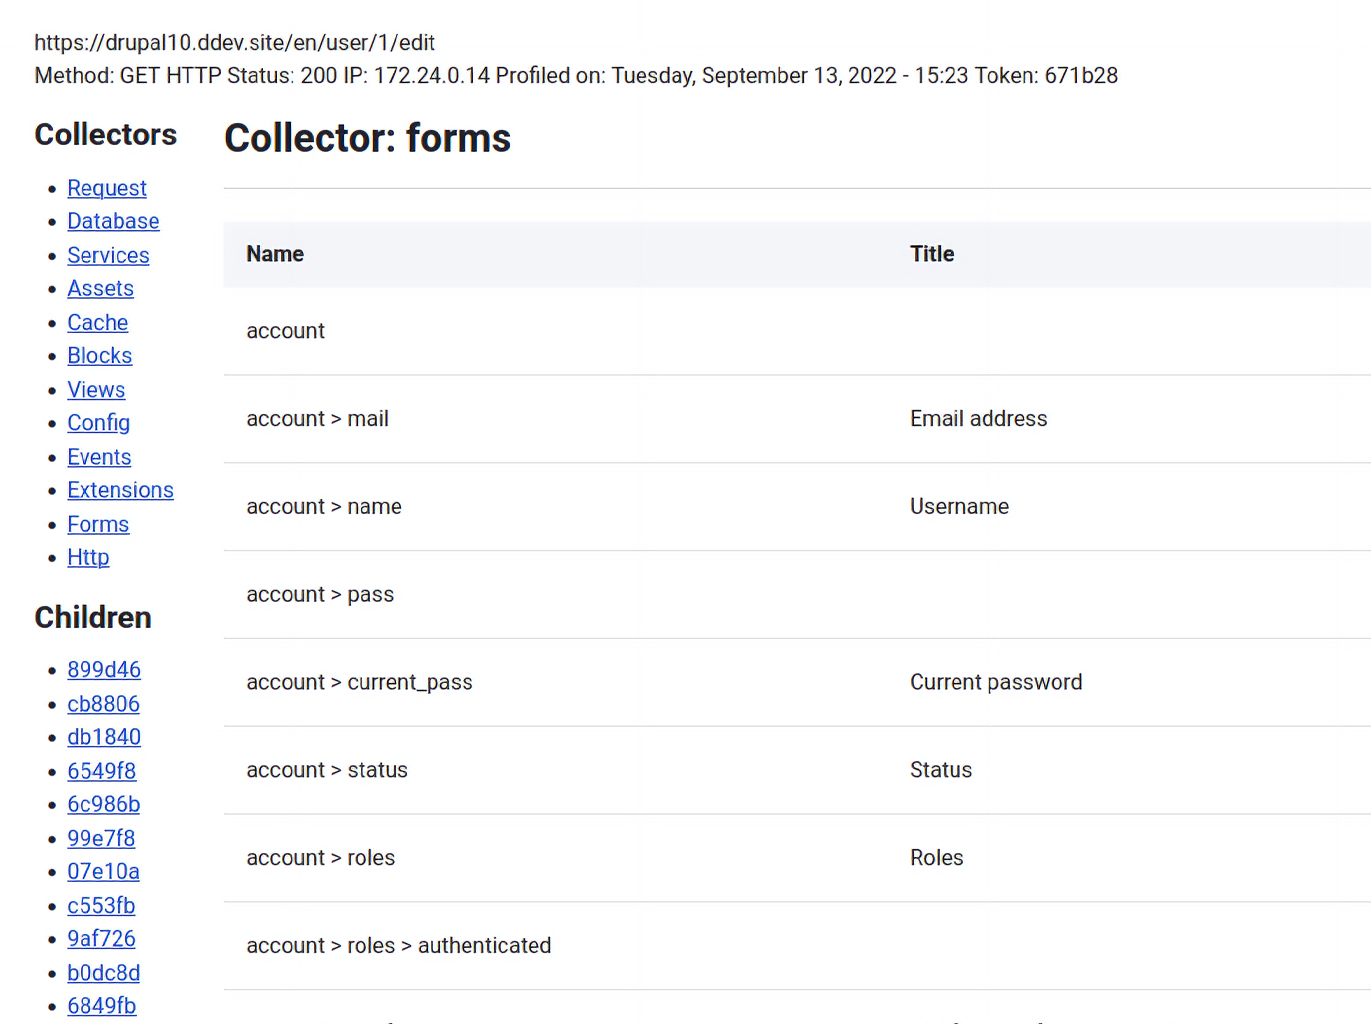
More data about forms
The Symfony version of the form data collector is awesome. Our version is simpler, but it’s getting more useful, release after release. Now the dashboard shows every level of a form array with some information like the type of an element and its access:
Introducing the Tracer project
There should be only one module that instruments the code at a time. We need to replace a lot of services and subsystems with traceable versions.
Right now we’re working on two different modules that do instrumentation: WebProfiler, to help developers to better understand how Drupal works and Observability suite (https://www.drupal.org/project/o11y) to provide traces and metrics of production websites.
To avoid code duplication we create a third project: Tracer (https://www.drupal.org/project/tracer) which both WebProfiler and Observability suite depend on.
To enable tracing and choose which implementation uses, a couple of lines needs to be added to the settings.php file:
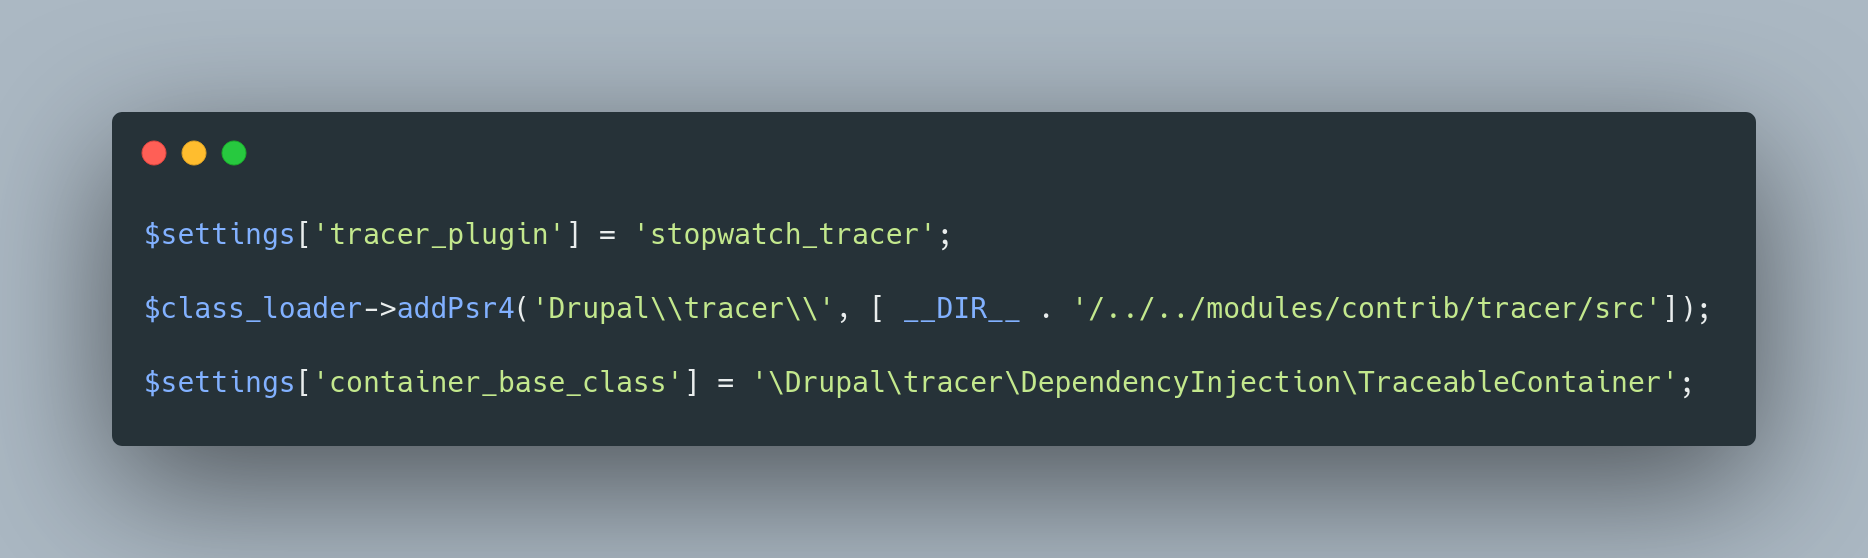
Right now tracer_plugin can be stopwatch_tracer to use WebProfiler to store traces or o11y_tracer to send a trace to a remote system (like Grafana) via the Observability suite module.
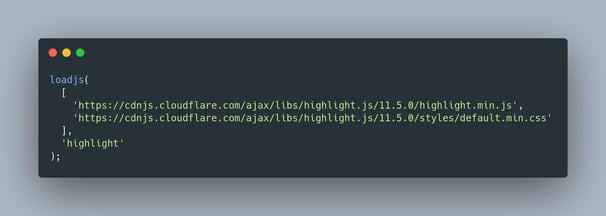
No more external js to import
One of the bigger pain points of the old WebProfiler was the need to alter the composer.json file of the website to download external javascript files. Now we use the loadjs library provided by Drupal core to directly add them:
More support to different IDEs
Every path to a file in the collected data is turned into links to directly open that file in an IDE. Every IDE has a different schema and format to do that. The new WebProfiler extends the list of supported IDEs:
- Textmate
- Macvim
- Emacs
- Sublime text
- Phpstorm
- Atom
- Visual studio code
Next steps and roadmap
And this is only the beginning.
17 out of 23 data collectors have been ported to the new WebProfiler.
We’re actively working on the new UI of the dashboard.
The whole work will be completed in time for Drupal 10 release, thereafter we will be able to concentrate on the next steps:
- Provide an in-depth documentation about how to add a data collector
- Collect content entities used to create a page
- Add more tests
- Add more data collectors
Register today for the next and unique Drupal event thought for the Italian Community! Dries Buytaert will be live and ready to answer your questions.